I’ve been using Chrome DevTools extensively for the past 1 year since I started working on a huge JavaScript application at work.
Some profiling tools need a context-switch; one needs to switch to the tab in the DevTools, start the measurements specifically. Some tools though, are more unobstrusive; those that we can have turned on all the time to nudge us in the right direction.
Two of such tools in Chrome DevTools that I have on all the time are:
Composite layer borders
There is a setting in Chrome that renders thin borders around composited elements1. It used to be somewhere the console drawer but as of latest Chrome Canary, it’s in the chrome://flags page. I have this setting turned on under the user profile I use for development, and this has helped me pre-emptively find possible rendering issues very early in the development cycle.
How this setting helps
If the page has a lot of complex layers that get modified frequently2, browser has to perform layout and paint calculations that might result in jank in the UI in certain conditions. When you turn on this setting—it’s under chrome://flags/#composited-layer-borders—you’ll get to see borders on elements that are on a new layer3 due to any of the myriad of reason they get promoted to one4. These borders look like:
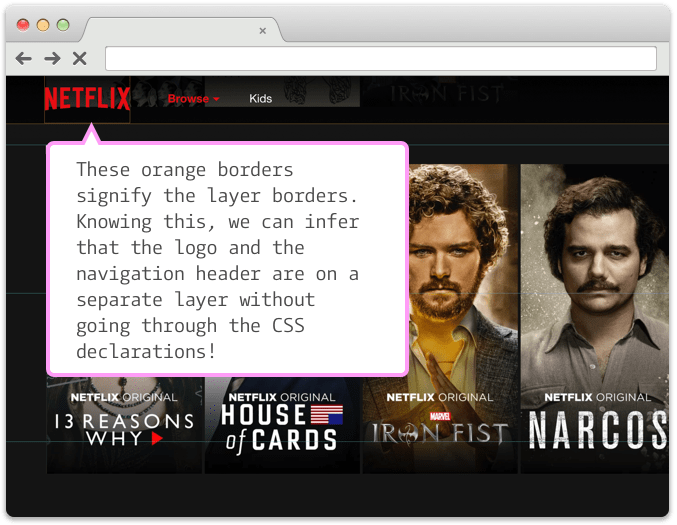
This is a screenshot of Netflix homepage with this feature turned on. Notice the orange borders around the logo, and the top navbar. These are the borders of elements that are on different layers than the rest of the page.
The benefit of this feature is compounded when there are dynamic changes on a page because of animations or user interaction. For example, on the same page, if I hover on one of the movie cards, I see this happening:

What’s worth noting is that in the short duration of the animation taking place, there are lots of layers created, and are kept until the mouse goes out of the element’s bounding box. Sometimes this is fine. But on slower clients, this can be pretty expensive and cause jank when the elements are being animated whilst the user is scrolling.
I found this very useful in discovering an issue—which would be non-obvious without this setting—in a website I was working on, where there were lots of layers getting created due to animations on relatively positioned elements. An example reproduction is present at this repo: repaints-on-transition
I’ve setup a demo of the problem using the code from above repo here: http://bl.ocks.org/kgrz/raw/1e7a24ee6f9ca825a401fc2a612c379d/
To see the problem, turn the said feature on, open the above page, and hover on an element. Note the borders around elements that are even 2-rows below the animating element. This is your browser trying to do two things:
- Animate the current object
- Figure out whether any elements are overlapping with the current object, by promoting all the elements into new layers.
Both of these move the elements into new layers temporarily so that GPU can speed up these calculations. If the boxes were very complex DOM nodes instead of the simplistic boxes in the example, this entire process might create jank when user scrolls while the animation is still on!
CPU Throttling
Chrome added a feature a while back which let you simulate slow clients by deliberately slowing down the CPU usage. The obvious part here is that any JS interactions done on the UI get slower, and the JS parsing time increases. This means heavy animations, complex DOM manipulations (like removing an entire tree of nodes for instance), and the size of the application’s source bundle will have tremendous side-effects.
The non-obvious part I missed was networks calls. On slow clients, the network response parsing (imagine huge chunks of JSON blobs) will be slower. Which might have a cascading effect of slowing down UI interaction. This is well explained by Andrew Clark (@acdlite) of React core team in his recent JSChannel talk.
I try to keep this turned on during general development as much as possible to get a feel for the way the application code works on slower machines. It has been very helpful so far. Highly recommended.
Fin.
Footnotes
-
Composited elements are DOM elements that are generally treated as a separate entity by the browser to ensure it can perform layout calculations really quickly. Think of 2 overlapping elements, one of which has a fixed position on it. When user scrolls, browser needs to figure out what’s the end result per scroll. For such use cases, browser renderers usually treat the fixed position element as a special one and do all the layout calculations in GPU as opposed to when the element is actually drawn on screen. This improves rendering speeds when scrolling. This is somewhat a super simplified explanation, but it will work for this example. ↩
-
Some very popular examples of this being parallax effects, closely followed by interception of input field events and rendering error messages on a new DOM element (toast messages) that’s positioned relatively with a higher
z-indexthan the rest of the page. ↩ -
Think of a “layer” in a browser as something akin to that in Photoshop or other graphic design tools. The end result when you save the file to something like a JPEG or a PNG is a flat image, but the source file can contain individual layers that build it up. ↩
-
A couple of reasons I can think of are (the embedded fiddles work in Chrome if you turn on the setting mentioned in this post):
a. A
transform: translate3d(0,0,0)directive on the elementb. A
overflow: scrollor aposition: fixedinside a relatively positioned parent.See the Pen layer creation by Kashyap (@kgrz) on CodePen.